Graphing Functions


Basics on the topic Graphing Functions
Graphing functions is pretty much the same as graphing equations, with the symbol f(x) being a fancy way of writing y. To graph a function f(x), follow the following steps:
(1) Pick some values for x. (2) Substitute in each value of x into f(x); the result will be the y value of the x which was plugged in. (3) Plot the resulting ordered pairs (x,y) in the plane. (4) If the equation is linear, connect the points with a line, otherwise connect the points with a smooth curve.
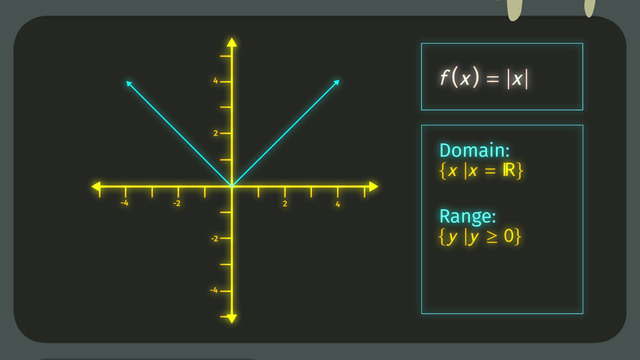
The domain (i.e. the x values) gives the vertical projection of the graph, whereas the range (i.e. the y values) gives the horizontal projection of the graph.
To determine if the graph is a function or not, we use the vertical line test: if any vertical line touches only one point of the graph, then the graph represents a function; this means graphically that every x is assigned to exactly one y. Otherwise, the graph does not represent a function.
Analyze functions using different representations. CCSS.MATH.CONTENT.HSF.IF.C.7
Transcript Graphing Functions
Stephanie Gawking is a math enthusiast, and her hobby is astronomy. From her backyard, she gazes through her telescope and dreams of discovering a new celestial body.
She sees a shooting star - which is a small, fast meteor. Although she knows the average speed of a shooting star is 30,000 miles per hour, she wonders about its path and how far it'll travel in a given amount of time.
What is a function?
To show the relationship between distance and time, we can look at a graph; the path of the star MAY be the graph of a function, but how do we know for sure?
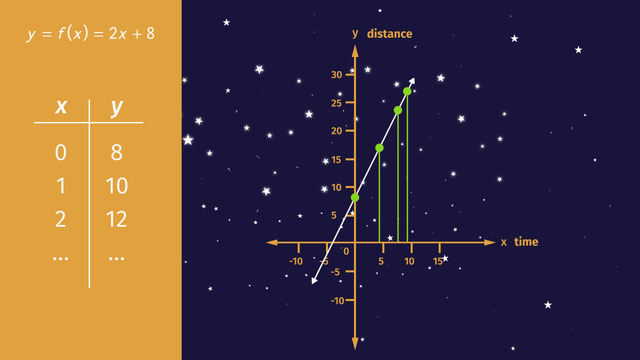
A function is a special relationship between two variables; in this case, the variables are the distance and the time. For each minute that passes, the star travels to a new location in the sky. If the graph of the star's path is a function, then for every input, time, there is a unique output, the location or the distance traveled. Let’s take a look at the function f(x) = 2x + 8. Notice that we used the function notation, f(x), this is just a fancy way of representing 'y'.
Graphing a function
Okay, let’s graph the function. It’s already written in slope-intercept form, y = mx + b. The y-intercept is equal to 8, and the slope, or rise over run, is equal to 2.
OR, you can write the values for 'x' and 'y' in a table. For instance, when x = 0, y = 8. When x = 1, y = 10, and so on. Next, plot a few points and connect the points on the line. We know the graph displays a function because each 'x' has only one 'y'. To double check that the graph is a function, we can also do a vertical line test. Draw in several vertical lines, if the lines touch the graph in only one place, then the graph is a function. If any line touches the graph in more than one place, it's not a function - it's that simple!
Graphing Parabolas
Let’s graph y = x2. To do this, we can create a function table and calculate a few points, then graph. If x = -2, then y = 4. If x = -1, y = 1, and so on. Notice the shape of this function. This distinctive u-shape is called a parabola. When you have a quadratic equation, the graph is always a parabola. How do we know if a quadratic equation is a function? For each x, there is only one y, and the graph passes the vertical line test.
Vertical Line Test
Looking through her telescope, Stephanie sees a constellation. It’s so curvy; is it a function? Let’s use the vertical line test to see if it is. Oh look! It passes the test! So this graph is also a function - for each input, 'x', there is one output, 'y'. Here’s another awesome constellation, but does its graph form a function? Because the graph passes the vertical line test, it sure does!
And, what about this one? It’s u-shaped, but it’s turned sideways. It fails the vertical line test, so no, it’s not a function. For each input, there is more than one output. Whoa nelly! This one looks like a circle. Is it a function? It fails the test, so no way.
Stephanie adjusts her telescope. Holy moly! Stop the presses! What's that? She thinks she's finally discovered a new celestial body. It’s a dream come true. Wait, is that a firefly?
Graphing Functions exercise
-
Describe how the given graph represents a function.
HintsWe have that $f(x)=2x+8$ is a function, as well as $f(x)=8x+2$.
A linear function in slope intercept form is given by
$f(x)=mx+b$,
where $m$ is the slope while $b$ is the y-intercept.
Each function is a relation but not each relation is a function.
SolutionFunctions are very special relations between variables. In particular, for us, they are relations between two variables, say $x$ and $y$, where every $x$ is related to at most one $y$.
For example, $f(x)=2x+8$ is a linear function with the slope $2$ and the y-intercept $8$; the corresponding graph is a line.
Given just a graph, how can we check if it represents a function? Well, we can use the vertical line test! Which says that a graph represents a function if any vertical line has only one point in common with the graph.
By drawing vertical lines over the graph of $f(x)=2x+8$, we can see that it passes the vertical line test and thus represents a function!
-
Decide which graphs represent functions.
HintsFunctions are special relations between variables. In particular, for us, they are relations between two variables, say $x$ and $y$, where every $x$ is related to at most one $y$.
Use the vertical line test: a graph represents a function if any vertical line has only one point in common with the graph.
SolutionTo check if a graph represents a function, you can use the vertical line test. The vertical line test says that a graph represents a function if any vertical line has only one point in common with the graph.
For example $x^2+y^2=16$ is a circle with radius $4$. This equation is not a function, as its graph does not pass the vertical line test.
We can see that the graph of the sideways parabola $x=y^2$ (i.e. the bottom right-most picture) also does not pass the vertical line test and thus does not represent a function.
All the other graphs represent functions, as they pass the vertical line test.
-
Complete the function table for the function $y=2x^2+3$.
HintsFor each $x$ you can calculate the corresponding $y$ by plugging $x$ into the function.
When $x=4$, we have that $y=2(4)^2+3=2\times 16+3=32+3=35$.
Pay attention to the sign of $x$. A negative number squared is a positive number.
SolutionHere you see the resulting graph as well as the three points $(0,0)$, $(-1,5)$, and $(1,5)$.
$~$
Any point lying on the graph is given by $(x,y)$, where $y=2x^2+3$.
$~$
We can construct a function table by taking some $x$-values and calculating their corresponding $y$-values:
- For $x=-3$ we get $y=2(-3)^2+3=2\times 9+3=18+3=21$
- For $x=-2$ we get $y=2(-2)^2+3=2\times 4+3=8+3=11$
- For $x=-1$ we get $y=2(-1)^2+3=2\times 1+3=2+3=5$
- For $x=0$ we get $y=2(0)^2+3=2\times 0+3=0+3=3$
- For $x=1$ we get $y=2(1)^2+3=2\times 1+3=2+3=5$
- For $x=2$ we get $y=2(2)^2+3=2\times 4+3=8+3=11$
- For $x=3$ we get $y=2(3)^2+3=2\times 9+3=18+3=21$
-
Decide which stars belong to the graph of the function.
HintsYou can check each star by plugging its $x$-coordinate into the function. The resulting $y$-value must match the $y$-coordinate of that star for that star to be part of the constellation.
Plugging $x=0$ into the function, we get $y=\frac{1}{10}(0)^2=0$.
So we can see that the star at $(0,0)$ belongs to the graph.
The star at $(-4,1)$ does not belong to the graph since
$y=f(-4)=\frac{1}{10}(-4)^2=1.6$, not $1$.
SolutionTo check if a star lies in our constellation, we need to plug in its $x$-coordinate into the function $f(x)=\frac{1}{10} x^2$ and see if the resulting $y$-coordinate is indeed the $y$-coordinate of that star. We can construct a function table to help figure out which stars are in the constellation:
$\begin{array}{c|r|r|r|r|r|r|r|r|r} x &-10 & -9 & -8 & -7 & -6 & - 5& -4 & -3 & -2 & -1 & 0 \\ \hline y & 10 & 8.1 & 6.4 & 4.9 & 3.6 & 2.5 & 1.6 & 0.9 & 0.4 & 0.1 & 0 \end{array}$
$\begin{array}{c|r|r|r|r|r|r|r|r|r} x & 0 & ~~~1 &~~~ 2 & ~~~3 &~~~4 & ~~~5& ~~~6 & ~~~7 & ~~~8 & ~~~9 & ~~~10 \\ \hline y & 0 & 0.1 & 0.4 & 0.9 & 1.6 & 2.5 & 3.6 & 4.9 & 6.4 & 8.1 & 10 \end{array}$
Graphing the points in this table, we see that the stars which belong to the constellation are: $(0,0),(10,10),(-10,10),(4,1.6),(6,3.6)$, and $(-5,2.5)$.
-
Explain how to draw the graph of the function $y=2x+8$.
HintsHere you see how to plot the point $(3,6)$ in a coordinate system.
You can write a linear function as $f(x)=2x+8$, as well as $y=2x+8$.
The $y$ corresponding to $x=3$ is $y=2\times 3+8=6+8=14$.
SolutionTo draw the graph of a function, first we need to draw a coordinate system with a horizontal line, the $x$-axis, and a vertical one, the $y$-axis.
You can either draw a line corresponding to a linear function by drawing the $y$-intercept and then use the slope to determine the other points on the line (Remember: the slope is given by rise over run), or you can figure out a function table of $(x,y)$ pairs.
To get these pairs, plug each $x$ value into the function; for example, the $y$ coordinate at $x=0$ is $f(0)=2\times 0+8=8$. So the pair we get is $(0,8)$.
From the function table, the graph of the function can be drawn by plotting the points from the function table on the coordinate system and drawing a line connecting all of the points.
-
Match the graph with its corresponding function.
HintsA line is the graph of a linear function.
A linear function in slope intercept form is given by
$y=mx+b$,
where $m$ is the slope and $b$ the y-intercept.
The graph of a quadratic function is a parabola.
If you know the vertex $(v_x, v_y)$ of a parabola you can write the corresponding equation as
$y=a(x-v_x)^2+v_y$.
SolutionHere you have two lines and two parabolas.
We first want to remember that:
- A line corresponds to a linear function.
- A parabola corresponds to a quadratic function.
Let's start with the lines:
- The line on the left has the y-intercept $5$ as well as this one on the right. But what is the difference? It's the slope!
- The line on the lieft has a negative slope while the line on the right has a positive slope.
- You get the slope using "rise over run": for the left line we have a rise of $-5$ and a run of $2$. So the corresponding function is $y=-\frac52x+5$.
- The rise of the right line is $5$ and the run is $2$. This gives us the function $y=\frac52x+5$.
Now for the parabolas:
- The left parabola has intercepts the $y$-axis at $(0,-4)$.
- So the left parabola is the parabola $y=x^2$ shifted down by $4$, and the corresponding function is $y=x^2-4$.
- The right parabola has intercepts the $y$-axis at $(0,1)$.
- So the right parabola is the parabola $y=x^2$ shifted up by $1$, and the corresponding function is $y=x^2+1$.